Most investors fail in the Memphis market because they fall in love with a property before they master the math. A high-yield deal on paper can quickly turn into a liability if you don’t account for the $2.70 per $100 tax assessment or the specific maintenance reserves required for older Bluff City inventory. You’ve likely felt the paralysis of analyzing too many metrics while worrying about hidden costs or shifting vacancy rates. It’s a common hurdle that keeps ambitious investors from scaling their portfolios with confidence.
You need a definitive way to separate high-margin opportunities from financial traps. This article provides that clarity. By using a professional grade Rental Property Calculator, you’ll learn to evaluate any deal in seconds and gain total confidence in your financial projections. We’re moving beyond basic spreadsheets to focus on the results that matter for your bottom line. We will break down exactly how to calculate your ROI, factor in current 2026 interest rates, and use exclusive off-market data to ensure every acquisition is a “Go.” You’re about to transform your sourcing strategy into a streamlined, profit-generating machine.
Key Takeaways
- Eliminate emotional bias and analyze potential deals in seconds using a professional-grade Rental Property Calculator to ensure every acquisition meets your margin requirements.
- Master the essential math of cash flow by categorizing acquisition, operating, and financing costs to protect your bottom line from hidden expenses.
- Distinguish between Cap Rate and Cash-on-Cash return to accurately measure property performance and the actual yield on your invested capital.
- Understand how local market variables like Memphis property taxes and Atlanta growth trends impact your ROI projections across different investment territories.
- Fuel your analysis with high-quality data by sourcing exclusive off-market deals through Lead Exchange’s Starter and Growth plans.
Why Every Investor Needs a Rental Property Calculator in 2026
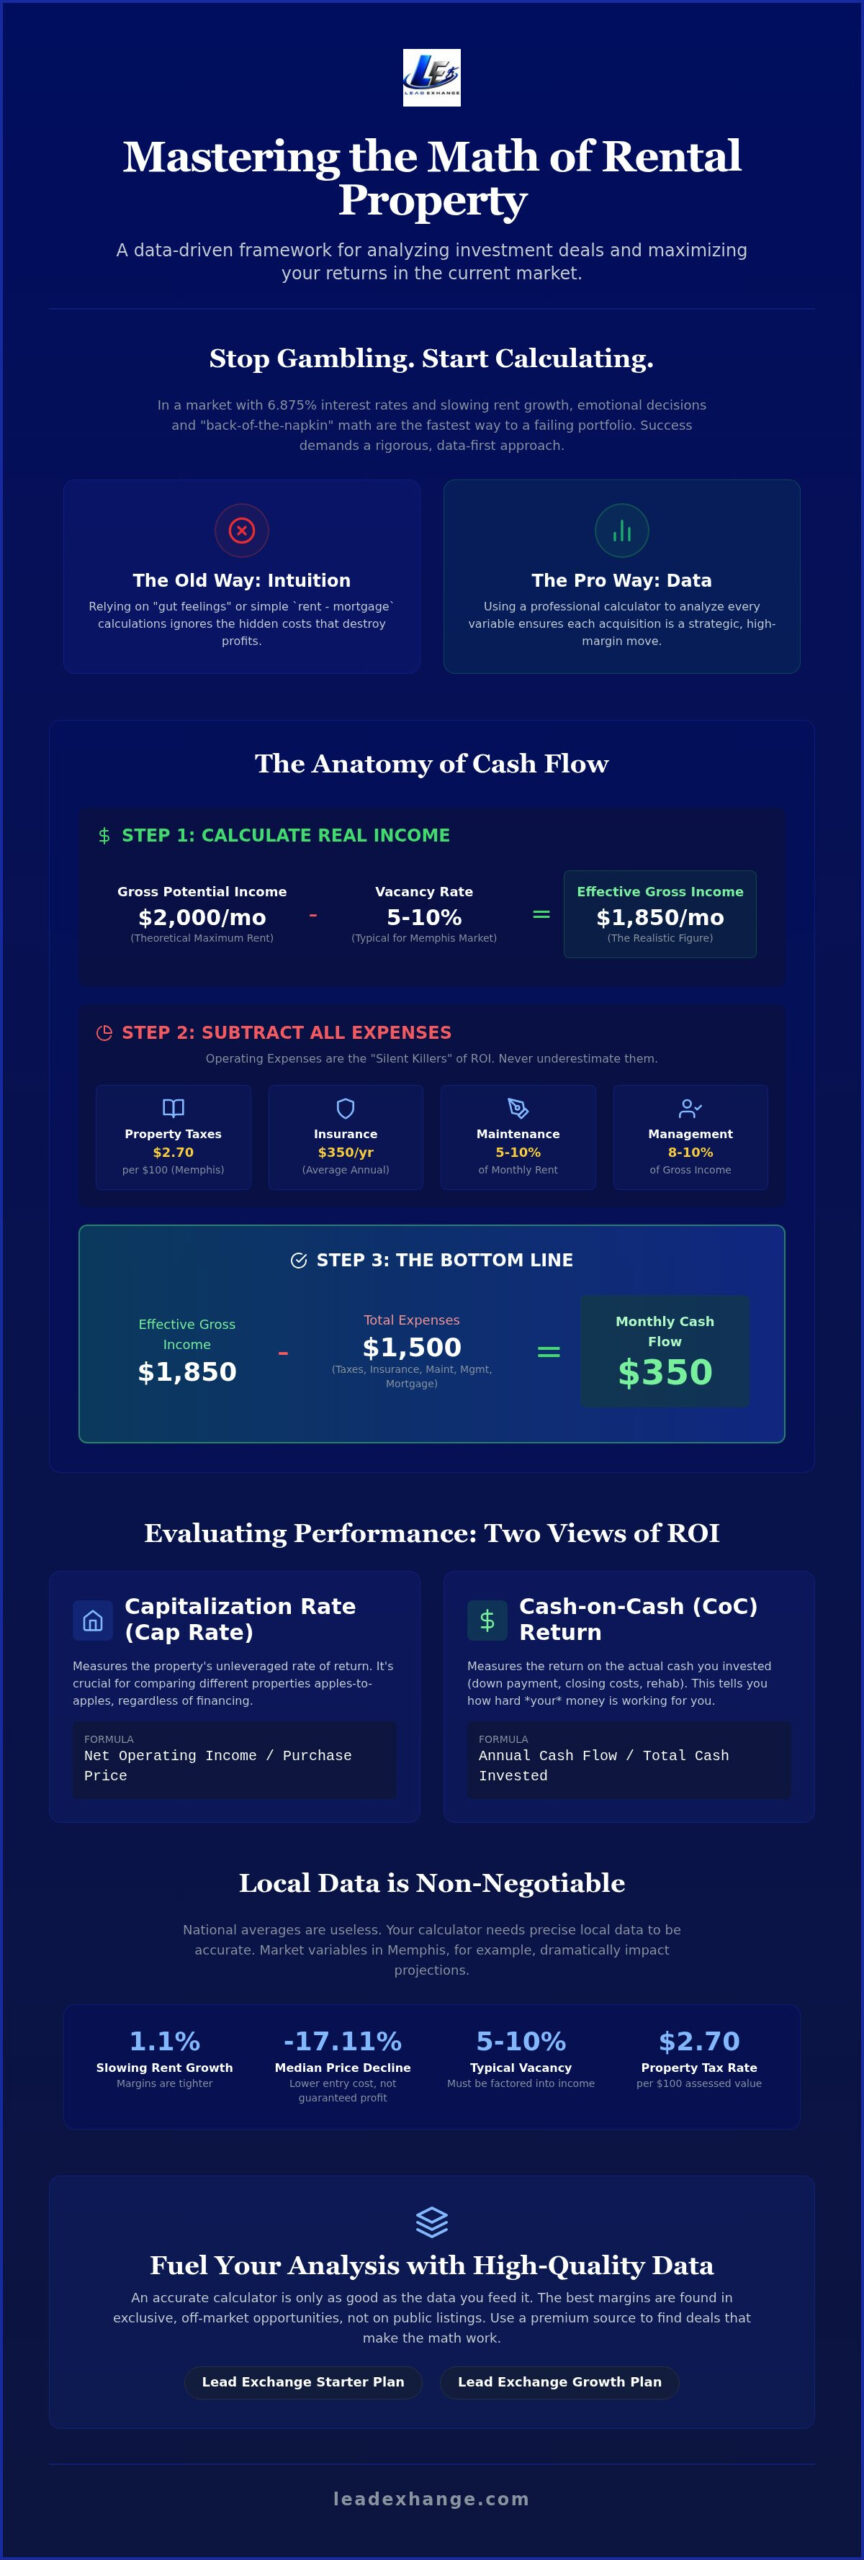
Real estate investing is a game of mathematics, not intuition. In a 2026 market defined by 6.875% interest rates and cooling rent growth, guessing is a liability. A Rental Property Calculator serves as your primary shield against emotional, low-margin purchases. It forces you to confront the cold reality of a deal before you commit capital. This tool is no longer optional; it’s the barrier between a profitable asset and a financial drain.
The era of “appreciation-only” investing has ended. Success now demands a cash-flow-first strategy that prioritizes immediate yields over speculative future gains. While the Memphis market has seen a 17.11% decline in median listing prices, savvy investors know that lower prices don’t automatically mean better deals. You must verify that the numbers work. The most accurate projections typically occur when analyzing off-market properties for sale. These exclusive opportunities often provide the margins necessary to withstand market volatility.
The Danger of ‘Back of the Napkin’ Math
Simple formulas like “rent minus mortgage” are a fast track to bankruptcy. They fail to account for the “silent leaks” that erode profit, such as capital expenditures, maintenance, and vacancy. In Memphis, where year-over-year rent growth has slowed to 1.1%, every dollar matters. Professional investors use a Rental Property Calculator to analyze the Capitalization rate and other key metrics. This rigorous process allows them to filter 100 potential leads down to the single deal that actually generates a return.
Calculators as a Tool for Scaling
Data builds institutional-grade confidence. When you approach lenders or private equity partners with a comprehensive financial breakdown, you demonstrate professional competence. A standardized review process allows you to evaluate properties with extreme speed, ensuring you capture high-value deals before the competition even opens their spreadsheets. Standardizing your math removes the friction of decision-making. Deal flow is the lifeblood of a scaling portfolio. By using reliable data, you transform a series of individual purchases into a high-performance investment machine.
The Math of Cash Flow: Breaking Down Income and Expenses
Mastering cash flow requires a ruthless approach to data organization. To get an accurate reading from your Rental Property Calculator, you must categorize every dollar into three distinct buckets: Acquisition, Operating, and Financing. This structure prevents “invisible” costs from eroding your returns. Your analysis starts with income, but you must distinguish between Gross Potential Income and Effective Gross Income. The former is a theoretical maximum; the latter is the reality of what hits your bank account after accounting for the 5-10% vacancy rates typical in the Memphis market. With average rents in Memphis currently ranging from $1,048 to $1,250, even a small error in vacancy projections can flip a deal from positive to negative cash flow.
Acquisition Costs: Beyond the Purchase Price
Your total investment basis is always higher than the contract price. You must account for closing costs, inspection fees, and the immediate rehab required to make the property rent-ready. If you are purchasing from a wholesaler, ensure the assignment fee is factored into your “cash-to-close” total. For properties requiring significant renovation before they can be tenanted, using a Fix and Flip Calculator helps you estimate value-add costs with higher precision. Ignoring these front-end expenses leads to a skewed ROI that won’t hold up once the keys are in your hand.
Operating Expenses: The ‘Silent Killers’ of ROI
Operating expenses are the recurring costs that dictate your long-term success. Taxes and insurance are non-negotiable and often represent the largest drain on revenue. In Memphis, the Shelby County property tax rate is $2.70 per $100 of assessed value for FY2027. Combined with an average annual insurance cost of $350, these fixed costs create a high baseline you must clear. Use your Rental Property Calculator to track these essentials alongside:
- Property Management: Factor in an 8-10% fee even if you self-manage; your time has a market value.
- Maintenance Reserve: Set aside 5-10% of monthly rent for routine repairs.
- Capital Expenditures (CapEx): This is a separate reserve for big-ticket items like roofs or HVAC units that fail every 15-20 years.
Professional investors treat these numbers as fixed realities rather than variables. To ensure your analysis starts with the best possible data, consider sourcing off-market investment deals that offer wider margins to absorb these operating costs. A deal that cannot survive a conservative maintenance reserve isn’t a deal; it’s a gamble.
Evaluating Performance: Cap Rate vs. Cash-on-Cash Return
Understanding the difference between property performance and personal yield is critical for any serious investor. Your Rental Property Calculator should prioritize two metrics: the Capitalization Rate (Cap Rate) and the Cash-on-Cash (CoC) return. The Cap Rate measures the unleveraged return on a property. It assumes an all-cash purchase to reveal the asset’s raw earning power. Cash-on-Cash return, however, measures the actual yield on the specific capital you’ve committed. While Cap Rate evaluates the property, CoC evaluates the investor’s efficiency. For long-term wealth projections, sophisticated players also track the Internal Rate of Return (IRR). This metric accounts for the time value of money and equity build-up over the entire hold period.
When to Prioritize Cap Rate
Cap Rate is the ultimate equalizer for comparing properties across different markets. It allows you to weigh a deal in Memphis against one in Detroit or Atlanta without the noise of varying financing terms. Commercial lenders rely on this metric to determine property value because it reflects the asset’s inherent risk profile. A “Class A” property in a premium neighborhood will show a lower Cap Rate, reflecting its stability. Conversely, “Class C” distressed assets offer higher Cap Rates to compensate for higher maintenance and vacancy risks. By inputting local variables into a Rental Property Calculator, you can determine if a high Cap Rate property is a genuine opportunity or a “yield trap” in a declining area.
Why Cash-on-Cash is the King of Cash Flow
Cash-on-Cash return is where your strategy meets your bank account. It accounts for the impact of leverage, such as a 30-year fixed mortgage at 6.875%. Debt allows you to amplify your personal return far beyond the property’s base Cap Rate. This is the metric that determines your ability to scale. You can use an Off-Market Property Calculator to identify deals capable of producing 15% or higher CoC returns. For BRRRR investors, this metric is the ultimate goal. When you successfully refinance and pull your initial capital back out, your CoC return becomes infinite. This represents the pinnacle of real estate efficiency. It allows you to scale your portfolio using the same pool of capital repeatedly.
Local Market Variables: Memphis, Atlanta, and Beyond
A “good” ROI is a relative figure that depends entirely on your geography. When you plug data into a Rental Property Calculator, you must tune it to the specific economic reality of your target city. In Atlanta, average rents between $1,659 and $2,297 are significantly higher than the national average, but median home prices of $380,000 to $430,000 create a higher barrier to entry. Compare this to Memphis, where you can acquire assets for $150,000 to $170,000. Lower entry costs in Memphis often result in higher immediate cash-on-cash returns, while Atlanta’s higher price point is a strategic play for long-term equity growth.
Property taxes and insurance premiums are the variables that most frequently break a deal’s profitability. Memphis investors must account for a Shelby County tax rate of $2.70 per $100 of assessed value. Meanwhile, Georgia investors are preparing for the HOME Act (Senate Bill 33), which will introduce inflation-based caps on property tax assessments starting in 2027. Insurance also fluctuates based on local risk. Inland cities like Birmingham or Jackson typically avoid the massive premium spikes seen in coastal regions, though Memphis insurance averages $350 annually, which is slightly higher than the Tennessee state average. These nuances must be hard-coded into your projections to avoid mid-year cash flow shocks.
Local Landlord-Tenant laws dictate your vacancy buffers and legal reserves. Tennessee’s HB 1814 has increased transparency requirements for landlords regarding property conditions and fees. In Georgia, you’re required to provide 60 days’ notice to end a month-to-month tenancy. These regulations impact how quickly you can turn over a unit and how much you should set aside for potential legal friction. Ignoring these local mandates in your Rental Property Calculator leads to unrealistic projections that won’t survive the first year of operations.
Analyzing High-Yield Markets: Memphis and Cleveland
Markets like Memphis and Cleveland are cash-flow favorites because they often show double-digit Cap Rates on paper. These high yields are a trade-off for the increased maintenance and turnover costs associated with older housing stock. You must build a more aggressive repair reserve when buying in these territories to protect your margins. Market Equilibrium in 2026 defines the state where rental demand and housing supply reach a balance, preventing the extreme rent spikes seen in previous years and rewarding investors who focus on operational efficiency.
Growth Markets: Atlanta and Charlotte
Investing in Atlanta or Charlotte requires balancing lower immediate cash flow against the high probability of appreciation. The competition in these hubs is fierce, often leading to bidding wars that compress your initial returns. To make the numbers work, you must adjust your acquisition model for these competitive environments. Sourcing off-market deals is the only way to avoid the “Atlanta Premium” typically found on the MLS, allowing you to secure properties at a basis that still supports a healthy yield.
Beyond the Math: Sourcing High-Margin Deals with Lead Exchange
A Rental Property Calculator is a precision instrument, but it’s worthless without high-quality fuel. You can’t calculate your way out of a bad entry price on the MLS. The most sophisticated financial models fail when they’re fed saturated, low-margin data from public listings. True wealth is built by finding the deals that never reach the general public. Lead Exchange bridges this sourcing gap by providing exclusive access to off-market inventory in high-performance cities like Memphis, Atlanta, and Detroit. We provide the raw data that makes your projections reliable and your offers competitive.
Exclusive Access with Starter and Growth Plans
The Starter plan is engineered for investors looking to secure their first 1-3 high-yield rentals. It provides the essential data points you need to validate a deal’s potential before your competitors even know it exists. For those ready to dominate a market, the Growth plan offers expanded data access designed for high-volume acquisitions. Scaling a portfolio requires a consistent stream of opportunities. Exclusive off-market data beats public listings every time because it removes the bidding war premium that erodes your cash-on-cash return. You aren’t just buying a house; you’re buying a margin of safety. This data allows you to see the true potential of a property without the noise of retail market emotions. You don’t have time to waste on the MLS when high-margin deals are available elsewhere.
Your Next Step: From Calculation to Acquisition
Efficiency is your greatest competitive advantage. You can plug Lead Exchange data directly into your Rental Property Calculator to generate a “Go/No-Go” decision in seconds. This speed allows you to submit offers while other investors are still waiting for an MLS notification. By the time a property hits the open market, the best profit has already been captured. Transitioning from a deal hunter to a deal closer means letting automated lead data do the heavy lifting. You focus on the analysis; we provide the opportunities. The goal is to move with total confidence. You’ll know exactly what a property is worth and what it will cost to rehab before you ever step foot on-site. This is how you win in 2026.
Ready to find your next high-yield property? Join Lead Exchange Today
Strategic Acquisition: Turning Data into Equity
Profitable investing in 2026 requires more than a general understanding of market trends; it demands a rigorous, data-driven approach to every acquisition. By mastering the Rental Property Calculator, you’ve moved beyond the “back of the napkin” math that leads to low-margin traps. You now have the framework to analyze Cap Rates, Cash-on-Cash returns, and local nuances in high-yield hubs like Memphis and Atlanta with total confidence.
The math is your foundation, but your growth depends on the quality of your deal flow. A calculator only confirms the value you’ve already found through superior sourcing. Lead Exchange provides the pragmatic, results-oriented tools you need to secure exclusive off-market inventory in Memphis, Atlanta, and Detroit. Whether you’re using our Starter plan for your first rentals or the Growth plan to scale rapidly, you’re gaining an elite advantage over the retail market.
Stop waiting for the MLS to provide your next opportunity. Take control of your financial future by combining professional analysis with exclusive data. It’s time to build the high-performance portfolio you’ve planned.
Frequently Asked Questions
What is a good ROI for a rental property in 2026?
A strong benchmark for cash-flow markets like Memphis or Cleveland is a cash-on-cash return between 8% and 12%. In high-growth areas like Atlanta or Charlotte, investors often accept a lower immediate yield of 4% to 6% in exchange for higher projected appreciation. You must ensure your return exceeds current mortgage rates, which sit near 6.875%, to justify the risk of a physical asset over passive investment vehicles.
How do I calculate rental property cash flow manually?
Subtract all monthly operating expenses and debt service from your effective gross income. Effective gross income is your total rent minus a vacancy allowance, typically 5% to 10% in markets like Birmingham or Jackson. Expenses include property taxes, insurance, and maintenance reserves. Using a Rental Property Calculator is the most efficient way to automate this process and eliminate the manual entry errors that often lead to poor acquisition decisions.
Should I include property management fees if I manage it myself?
Yes, you should always include an 8% to 10% property management fee in your projections. Your time has a specific market value that must be accounted for to determine the true profitability of an asset. Including this expense ensures the deal remains viable if you eventually transition to professional management. Lead Exchange focuses on high-margin residential real estate, ensuring your deals are strong enough to support these essential operational costs.
What is the difference between Cap Rate and ROI?
Cap Rate measures the unleveraged performance of a property by dividing Net Operating Income by the purchase price. It evaluates the asset as if you paid all cash. ROI, specifically cash-on-cash return, measures the yield on the actual capital you have committed after financing. While Cap Rate tells you about the quality of the property, ROI tells you how effectively you are using leverage to scale your personal wealth.
How much should I budget for maintenance and CapEx?
Budget 5% to 10% of monthly rent for routine maintenance and an additional 5% to 10% for capital expenditures (CapEx). Older housing stock in cities like Detroit or Cleveland requires more aggressive reserves than newer builds in Charlotte. Maintenance covers minor repairs like plumbing leaks, while CapEx funds major structural items like roof replacements or HVAC units. Consistent reserves protect your cash flow from the sudden financial shocks of major system failures.
Can I use a rental property calculator for multi-family units?
You can use a Rental Property Calculator for multi-family units by aggregating the total income and expenses across all units. The fundamental logic remains identical, though you must account for higher vacancy risks and potential shared utility costs. Multi-family assets often provide better economies of scale. Sourcing these deals through the Lead Exchange Growth plan provides the exclusive data necessary to analyze these complex, high-volume opportunities with professional precision.
What is the 1% rule in real estate, and is it still valid?
The 1% rule suggests a property should rent for at least 1% of its purchase price. In the 2026 market, this benchmark is difficult to hit in growth hubs like Atlanta but remains a viable initial filter for cash-flow markets like Memphis or Gulfport. It is a useful shorthand for speed, but it should never replace a comprehensive financial analysis. Always verify the specific local taxes and insurance before making a final offer.
How do I estimate vacancy rates for a city I don’t live in?
Consult local market reports or professional property managers to find current data for specific neighborhoods. In 2026, vacancy rates in Memphis and Atlanta typically hover between 5% and 10%. Using a conservative 10% buffer in your projections ensures your cash flow remains positive during tenant turnovers. Subscription tiers like Starter or Growth provide access to exclusive off-market data, helping you identify high-demand areas where vacancy risks are naturally lower.
Disclaimer
The opinions and information shared on this website are for educational purposes only. Results from real estate investing and lead generation vary, and no specific outcome or profit is guaranteed